
What are planograms used for, and can the method help you plan better store displays? Retailers create visual diagrams to optimize space while increasing sales.
Although it takes a bit of time to set up, once you have a blueprint, it’s easier to design and maintain captivating displays.
Learn how to make a planogram and use it to appeal to customers and sell more items.
What Is a Planogram? Definition and Uses
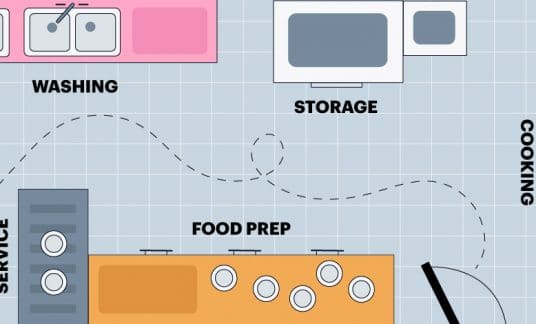
A planogram is a store diagram showing product placement. These drawings are your store’s blueprint displaying the location of your point-of-sale (POS) system, aisles and product displays.
Retailers may use several terms to describe this visual merchandising tool, such as:
- Plan-o-gram
- Schematics
- POG
- Shelf space plan
- Plano-gram
- Visual merchandising diagram
The detailed schematics list the size of your fixtures, shelves and racks. It includes the length, width and height to make it easier to determine where to put items.
After completing a planogram template, you can review your sales analytics to figure out which items garner the most attention and sales. Retailers may analyze the sales volume, seasonal importance or product profit margins using POS data.
Depending on your store’s size and the number of products, a planogram can be very complex or relatively simple. Large retailers use software, whereas small businesses may create a simple plan on paper.
What Are Planograms Used For?
The purpose of a planogram is to increase sales while maximizing every bit of retail space.
This is important because Nielsen reports consumers “spend less than 15 seconds in front of any given shelf and notice less than 40% of the products in a specific category.”
A planogram helps customers find products quickly and can even help prevent product damage or customer injury.
Retailers and wholesalers use diagrams to:
- Assist with inventory control
- Reduce out-of-stock items
- Efficiently restock shelves
- Plan customer-centric displays
- Visualize seasonal elements
- Position products based on data
- Improve the customer experience
Stores such as Lowe’s or Walmart rely on planograms to decide how many stock-keeping units (SKUs) fit on each shelf. Retailers use their visual merchandising model to make predictions about sales or inventory use.
Moreover, suppliers may ask retailers to share their planograms to ensure correct product placement.
Retail Planogram Benefits
Whether you use a simple planogram or a detailed model, having a diagram of your layout makes it easier to plan your product displays.
Planograms provide several advantages, including:
- One source of truth: A planogram represents your store layout with exact measurements of every element. You can plan product or display changes without stepping foot on the store floor.
- Maximize sales: POS data combined with planograms lets you see how location helps or hinders sales, allowing you to optimize every inch of selling space.
- Unload slow-moving items: With a planogram, you can identify the best spot to place older merchandise for faster sales.
- Optimize space: Get the most from your floor, fixture and shelf space by knowing the exact measurements and comparing that with SKU information.
- Improve product placement: From cross-merchandising to upselling, a planogram helps you visualize paths through your store and rearrange it to increase sales.
- Better inventory management: Optimize inventory management using your diagram and a barcode scanner. Doing so helps you quickly replenish stock and ensure it’s in the right place every time.
How to Make a Retail Planogram
Follow these steps to make a retail planogram:
- Start with a store layout
- Get accurate fixture measurements
- Determine product dimensions
- Develop a planogram template
- Visualize product placement
- Finalize your planogram
Several software solutions help you build a planogram, but you also can sketch it out on paper. Learn how to create a planogram using these tips.
1. Start With a Store Layout
Use an existing store diagram to show aisles and spacing. It should account for every inch of space in your store.
Write down aisle length and width, and note the location of check-out counters, mirrors, fitting rooms, restrooms or any other permanent elements.
If you aren’t using software to complete your planogram, use graph paper and a pencil to sketch out your plan.
Don’t forget to note what scale you’re using. On graph paper, each box may equal 1 inch or 1 foot or any dimensions you choose, as long as you use the same measurement throughout your planogram.
2. Get Accurate Fixture Measurements
Write down the dimensions of every shelving or rack unit, endcap displays, signage or other fixtures. Use a measuring tape to determine:
- The length, depth, width and height of each shelf
- The number of and distance between shelf sections
- The number of shelves or racks per unit
- Any space between units used for seasonal displays
3. Determine Product Dimensions
Make a list of every product that goes on your shelves and its dimensions. For example, you may measure how much space a single folded shirt takes up on a shelf versus the space required to display on a hanger.
Some manufacturers provide measurements. But make sure you’re accounting for product packaging as well.
4. Develop a Planogram Template
Turn your store layout into a planogram by drawing dimensionally correct fixed displays and accounting for spacing between fixtures.
Consider labeling displays with numbers or letters, then add a key or legend with the specifics.
5. Visualize Product Placement
Now, you have the main blueprint showing unmoveable fixtures alongside a list of all products and dimensions.
With a software program, you can use actual product images to visualize placement. Each image refers to universal product codes (UPCs) or SKUs.
If you’re creating a planogram by hand, you can print icons or images with the product information on the back.
Organize your items using POS data, following the best-merchandising principles, and thinking about:
- Visual appeal
- Seasonal need
- Inventory volume
- Price
- Brand or category
- Days of supply (DOS) data
Consider asking your retail teams for additional information. Floor staff may recall customers asking for help finding specific items. Customer service agents can share client feedback about store layout, product availability or item location.
6. Finalize Your Planogram
Once you’ve completed your planogram, then you need to make it user-friendly. Think about how employees may use your schematics and what extra information they may want to do their job.
For instance, you may add shelf labels, a color key or a legend to show:
- Product names, categories or brands
- UPC or SKU numbers
- Potential product substitutions
- Notes for stockers, such as how to rotate items
If you use cubbies for jeans, will you sort the pants by brand, style or color? Furthermore, do you want items placed in the cubby according to size? Include all of these notes to ensure proper product placement.
How to Read a Planogram
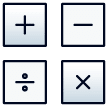
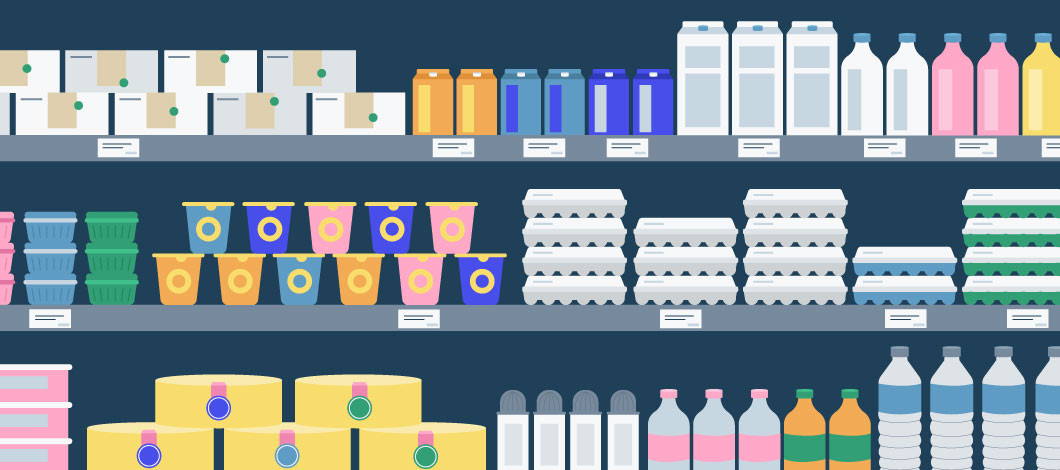
To read a planogram, look at the UPC or SKU and match it to the diagram’s product location. Count the number of units required and whether they’re stacked on top of each other or sitting side-by-side.
Remember to account for spacing between products to ensure the shelves meet visual appeal and customer experience standards.
Since there are many ways to create a planogram, each schematic needs its own instructions. A merchandiser or employee should be able to:
- See the number of facings (shelf space per product)
- Compare the barcode to existing products
- Read notes applicable to their job
- Distinguish between pegboards, slat walls, end caps and shelves
For best results, create a cover page with instructions on reading a planogram and using it for various tasks. Instructions may differ for employees replacing out-of-stock items versus staff creating seasonal displays.
Planogram Examples
One of the best ways to visualize a planogram is to search on Pinterest or a search engine for your specific product categories. Search for “planogram clothing” or “planogram shoes” to find planogram examples to copy.
Manufacturers may provide visual documents to help with product placement or recommend complementary items. General Mills offers specifications, examples and best practices for retail cup yogurt planograms.
Although franchisees may share planogram samples, many retailers prefer to customize the schematics to fit local buying habits and consumer needs.
Getting Started: Planogram Best Practices
Accurate measurements are vital to your planogram. However, your blueprint is only a guide. To meet your retail goals, you need to get your employees involved, master visual merchandising skills and rely on data.
Get Retail Teams on Board
If your team doesn’t understand your planogram’s purpose or how to read a planogram, it isn’t going to work well. You need their buy-in for successful implementation.
Consider providing insight into why you’re using one, how it’ll help them do their job and how it benefits them to use it.
Adhere to Merchandising Principles
Come up with creative retail display ideas by following visual merchandising best practices and creating guidelines for product placement.
A few planning principles include:
- Place products with the front label facing out
- Arrange differently sized items from left to right
- Leave 2 fingers above the top of the product and the next shelf
- Use top shelves for niche items or regional brands
- Put high-inventory and sales volume items on the bottom shelves
Optimize Displays Using Data
Many retailers start with a real-o-gram, a planogram showing your shelves and product placement before optimization. By doing this, you can see how adjustments affect your sales.
Business owners also may use consumer decision trees to determine what people think about and do when shopping for items in a group, such as pants versus undergarments.
In the case of General Mills, grocers organize yogurt “by type, then brand, then flavor (based on consumer shopping behavior).” So, a grocer would use POS data to determine which flavors should be in front.
You can figure out if certain items perform better at eye-level or in end caps by using point-of-sale and inventory management software.
Maximize Your Retail Space
Appealing displays attract shoppers and help them find their favorite products. But organizing products on shelves can be time-consuming because it’s not an exact science.
Get the most from your retail space while keeping customers top-of-mind by using planograms informed by customer data.