If you’re trying to identify the factors driving your company’s performance, or if you’re trying to woo investors, the DuPont analysis is a powerful tool.
The DuPont analysis formula goes a step beyond other popular profitability measures by determining how efficiently your company is utilizing investor equity and what underlying factors guide how well you use equity.
Here’s an in-depth look at the DuPont framework of analysis, how it can benefit your business, how you use it and how you can apply it to improve your performance or attract investors.
What Is DuPont Analysis?
The DuPont analysis equation, also known as the DuPont identity, was invented in 1912 by DuPont salesman Donaldson Brown. Brown had an electrical engineering background and was tasked by company treasurer John Raskob to use his knowledge of statistical formulas to evaluate DuPont’s sprawling business interests.
Brown came up with an equation that went a step beyond other profitability measures by breaking down how a company’s utilization of equity is affected by underlying variables. The DuPont equation can help you pinpoint whether your sales, asset utilization, debt management or other variables drive your performance and which of these factors you’d need to address to improve your results. This can benefit internal operations by improving your company’s financial management and making your company more attractive to investors.
Since Brown’s time, the original DuPont equation expanded to isolate how operational efficiency and interest expenses affect performance.
The DuPont formula builds on a traditional financial ratio known as return on equity (ROE).
Return on Equity Defined
-
ROE is a ratio that divides a company’s net income by the amount equity stockholders have invested in the business. The resulting percentage indicates how efficiently a company is converting stockholder investments into profits. This tells investors how profitably a company is using their investments, which helps determine whether they’ll continue investing in the company and how much they’ll invest.
While ROE is a useful measure, it has some limitations that can lead to misleading interpretations. For example, the ROE ratio can increase if a company takes on more debt by borrowing more loans, which reduces shareholder equity and thereby decreases the denominator in the ratio. Shareholders may misinterpret this as an increase in sales or profitability when it merely means the company has increased the proportion of its financing from loans rather than investors.
The 3- and 5-Step DuPont Models
To avoid such misinterpretations, the DuPont analysis formula factors in what underlying variables are affecting ROE. Brown’s original method, known as the “3-Step DuPont Model,” breaks ROE down into 3 contributing factors that affect ROE:
- Net profit margin (NPM): How efficiently a company’s operations generate profits in proportion to expenses
- Total asset turnover (TAT): How efficiently a company generates profits in proportion to its assets
- Financial leverage (FL): How efficiently a company manages its assets in relation to the amount of equity investors contribute
Multiplying these 3 ROE components cancels out the numerators and denominators, yielding a raw percentage representing ROE.
This formula separates how operational efficiency, asset efficiency and efficient use of equity contribute to ROE. However, because all 3 variables are multiplied, operational factors are not sharply separated from financing factors such as loans and equity, which can blur how they contribute to the total picture.
To make this clearer, the basic DuPont formula can be expanded by breaking net profit margin down into a product of 3 ratios representing:
- Pre-interest pretax profit margin: How much of its earnings before interest and taxes (EBIT) a company keeps as profit from its sales
- Interest burden: How much EBIT goes towards repaying loan interest
- Tax efficiency: The effect of taxes in relation to EBIT and interest
When these additional ratios are integrated into the original 3-step equation, it yields a total of 5 ratios being multiplied together, so this is called the “5-step DuPont Model.” As in the 3-step version, the units in the 5-step version cancel out, leaving ROE. The additional steps highlight how loan interest and tax rates affect ROE.
Why Do a DuPont Analysis?
DuPont analysis interpretation is useful for several reasons:
- You can use the DuPont analysis formula to identify how specific variables affect your use of shareholder equity and your overall profitability. For instance, you might identify how much of your profits are going toward repaying interest.
- You can use this information to optimize your financial management, such as increasing sales activity, lowering expenses or refinancing a business loan.
- You can also use DuPont analysis results to showcase your already efficient use of equity to investors or to find ways to improve your efficiency to impress future investors.
When using the DuPont method, remember that how you apply its results will depend on your industry. Some industries, such as fashion retail, heavily rely on high profit margins. So, in this case, a DuPont analysis might be used to identify how sales volume can be increased without shrinking profit margins.
In contrast, a fast-food chain might have low profit margins with high asset turnover rates. Other industries, such as heavy machinery sellers, might have very high profit margins offsetting low sales volume.
An experienced financial analyst can help you apply the DuPont method to your industry.
The DuPont Analysis Formula: 2 Methods
The DuPont analysis formula has 2 different versions: the 3-step and 5-step equations. Let’s take a closer look.
The 3-Step DuPont Equation
In a 3-step DuPont analysis, you multiply your net profit margin ratio by your total asset turnover ratio by your financial leverage ratio (called your equity multiplier) to get your ROE. This is equivalent to multiplying the ratio of net income over sales revenue times the ratio of sales revenue over average total assets times the ratio of average total assets over average shareholders’ equity.

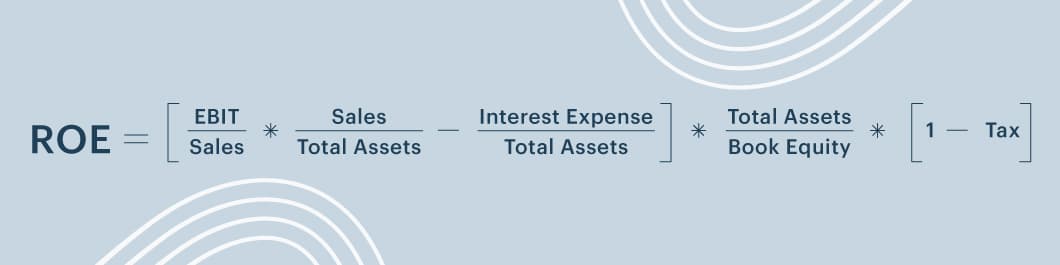
The 5-Step DuPont Equation
In a 5-step DuPont analysis, you multiply the ratio of net income over pretax income times the ratio of pretax income over earnings before interest and taxes (EBIT) times the ratio of EBIT over sales revenue times the ratio of sales revenue over average total assets times the ratio of average total assets over average shareholders’ equity.
The information you need to perform these calculations comes from your income (profit and loss) statement and your balance statement.
DuPont Analysis Example
To illustrate a simple 3-step DuPont analysis example, consider 2 retailers with the same ROE, 30%, but different underlying variables.
| Retailer 1 | Retailer 2 | |
| ROE | 30% | 30% |
| Profit Margin | 20% | 15% |
| Total Asset Turnover | 0.5 | 2 |
| Financial Leverage Factor | 3.0 | 1.0 |
-
Retailer #1 has a profit margin of 20%, a total asset turnover of .50, and a financial leverage factor of 3.0.
Retailer #2 has a profit margin of 15%, a total asset turnover of 2, and a financial leverage factor of 1.0.Both retailers have the same ROE of 30%, but Retailer #1 has a high profit margin with a low rate of sales turnover, whereas Retailer #2 has a lower profit margin with a higher sales turnover rate. This example illustrates why a DuPont ratio breakdown can be more informative than a simple ROE.
How Do You Apply a DuPont Analysis?
To apply the DuPont analysis formula to a practical situation, do the following:
Step 1
Decide what your goals are and which variables you want to highlight. This will help you decide whether to use a 3-step or 5-step DuPont equation.
For instance, if you’re going to isolate how loan interest payments affect your profitability so you can decide whether to refinance your loan, you will want to use the 5-step DuPont formula.
Step 2
After deciding which DuPont formula to use, you can import the relevant data from your income and balance statements into the DuPont formula.
The most efficient way to do this is to automate the process by syncing your accounting software with a business intelligence dashboard that displays your DuPont variables at a glance as key performance indicators. Your accountant or financial analyst can work with your IT support to set this up.
Step 3
Once you have your data, the next step is to optimize your performance to achieve your desired goals.
Depending on your goals, this may require you to increase your sales activity, cut your operational costs, change your financing strategy or change your tax strategy, to name a few possibilities.
Using a DuPont analysis to improve your performance in one of these areas can be used to improve your company’s internal financial management, or it can be used to enhance your company’s image in the eyes of investors or potential investors.