Opportunity cost: Every move you make may cost you — some more than others.
We’ll explain what it means, why it’s important and how to use it in business. We’ll cover how to calculate it, too.
What Do We Mean by Opportunity Cost?
Here’s the concept: Every time you make a choice, you are giving up one value by picking another. In other words, every benefit has its price. The value of the most valuable alternative you give up by not choosing it is your opportunity cost.
This idea can be used to compare the value of one alternative with another to determine which move would be more costly. You can use this approach to evaluate everyday business decisions.
Opportunity cost refers to the value of the most valuable alternative you didn’t choose. If there are several alternatives, you need to identify the most valuable one to do an effective opportunity cost analysis.
For Example …
A common opportunity cost example in business is the cost associated with deciding to make one product over another.
-
Example No. 1
Say my company is producing 3 units of good X and 12 units of good Y. I have limited production capacity. If I want to increase my production of good X to 4 units, I have to decrease my production of good Y to 9 units.
This means the decision to increase my production of X by 1 cost me the value of 3 units of Y. My opportunity cost is the dollar value of what I would make by selling 3 units of Y.
You can use this approach to compare investment choices, too.
-
Example No. 2
Let’s say I have a certain amount of money I could invest in either gold or silver for the next 3 years. If I choose to invest it in gold, I can’t invest it in silver. I decide to invest it in gold. After 3 years, it turns out that the cost of silver has risen 300%.
By not investing in silver, I ended up forfeiting triple the amount of money I invested. This is my opportunity cost.
This example illustrates how you can compare the opportunity cost of two alternatives.
Let’s say that during the 3-year period the cost of gold rose 150%. Comparing the opportunity cost of silver with the amount I earned from gold shows that silver would have earned me 150% more on my investment. In this case, the comparison shows I made a less profitable investment than I could have.
Identifying which option represents the costliest choice will help you make more profitable investment and business decisions.

Types of Opportunity Cost
Opportunity costs are often divided into two major categories:
- Explicit costs
- Implicit costs
Explicit costs are direct financial expenses. For example, the costs of purchasing a new building, investing in new equipment or hiring an additional staff member would be explicit costs.
Implicit costs represent expenditures of resources that indirectly translate into financial costs. Say a business owner who chooses to spend 80 hours a year doing her own taxes instead of hiring a tax preparer. She has lost 80 hours of labor. Her time is worth $300 an hour. The implicit cost of giving up 80 hours of productivity is $24,000. The business owner might compare this cost with the cost of hiring a tax preparer to determine which is the more expensive alternative.
Some implicit costs can be difficult to quantify. For instance, the business owner might consider the stress she might avoid if she hired someone else to do her taxes. This doesn’t have a direct monetary value, although it may have financial implications in terms of the health-care costs associated with stress.
Items difficult to quantify can be evaluated in terms of quality rather than quantity or they can be translated into numerical terms by ranking them on a scale of 1 to 10.
The Difference Between Marginal Opportunity Cost and Total Opportunity Cost
Another way to categorize opportunity costs is by distinguishing between marginal opportunity costs and total opportunity costs. This distinction is used when economists create a chart comparing how much increasing the units of production of one product decreases the number of units of another product that could be made instead.
Indeed, as you increase the production of one item, the opportunity cost of producing the alternate item increases. This is because the more units of one item you produce, the more units of the other item aren’t being produced.
Marginal opportunity cost is the change in opportunity cost incurred by increasing production by a certain number of units. Total opportunity cost is the sum of all marginal opportunity costs across all units on an opportunity cost chart.
Constant Opportunity Cost vs. Increasing Opportunity Cost
Opportunity cost charts can involve a distinction between constant and increasing costs. Sometimes increasing production of one item decreases the production of another item by a constant rate in proportion to the amount of the increase.
For instance, every additional 10 units of one item decreases the production of the other item by 10 units. In this case, the cost is changing at a constant rate, and a graph of this change would form a straight line.
Increasing production of one item may decrease the production of the other item by a varying amount depending on how much change in production there is.
For example, an additional 10 units of one item might decrease the production of the other item 10 units. But increasing the first item another 10 units might decrease the other item 20 units. In this case, the opportunity cost is growing at an increasing rate, and the graph would form a curve.
Opportunity cost may decrease along a curve. In some cases, it may increase for a certain range and then reach a maximum before it decreases, or vice versa. Graphing this type of curve can be useful for identifying an optimal balance to maximize the production of 2 products.
Why Is This Concept Important?
In general, this concept can be used to weigh the cost of any business decision against another. Opportunity cost in economics often is used to make production decisions based on comparing the cost of producing one type of good versus another. It also can help you weigh the return of one investment option against another.

How to Calculate It
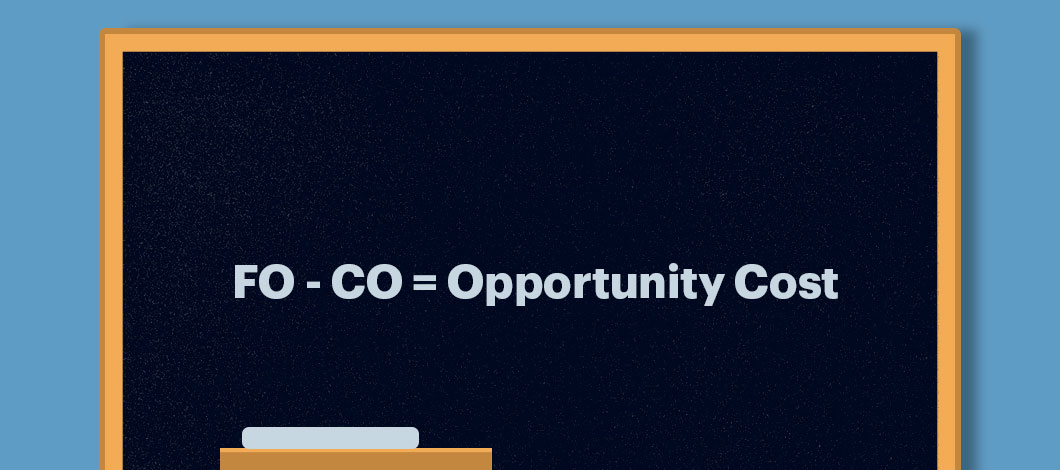
A standard opportunity cost formula is:
Opportunity Cost = FO – CO
In this formula, FO stands for “foregone option.” CO stands for “chosen option.”
- FO represents what would have been gained by choosing the most valuable foregone option
- CO represents what was gained by selecting the chosen option
You can determine whether the foregone option would have yielded more profitable results than the option which was actually chosen.
Applying an OC Analysis
An opportunity costs analysis can be applied a couple of different ways.
One way is to compare the value of a forgone decision with that of a decision that has already been made. This gives you the benefit of hindsight, which won’t let you turn back time to change a bad decision, but can prevent you from repeating the mistake in the future.
This approach can be applied proactively. Instead of waiting until after you make a decision to compare opportunity costs, you can estimate them before you pull the trigger.
A limitation of this approach is that some outcomes can only be estimated. Still, making an educated estimate is more objective than simply guessing. Consider using artificial intelligence to analyze historic data can increase the objectivity of your projections.
Weigh the Costs to Optimize Your Business
Calculating your opportunity costs can help you quantify the pros and cons of choosing one business alternative over another. To calculate, take the value of the option you’re considering passing up and subtracting the value of the option you’re considering taking.
Use this approach to help you make business decisions that minimize your costs and maximize your return on investment.


