
For your website to be successful, you want it to serve a purpose. Learning how to measure website performance metrics is crucial.
Whether it’s to generate leads from your marketing efforts or achieve high conversion rates to hike up sales doesn’t matter. What’s important is that you know how to monitor your business website for these key performance indicators (KPIs).
And using the gathered metrics, you should achieve your business goals and generate more revenue.
In this post, you will learn the different web performance metrics you must measure and measure the performance of a website using other tools.
What Is a KPI?
A KPI is a metric used to determine how well your website is performing. You can use them to track the success of different aspects of your company. Examples include how many customers were contacted over the phone and how much revenue was generated by those interactions.
It’s important to know what each indicator means to figure out how it impacts your bottom line and make improvements where needed.
What About Web Traffic?
One thing you must understand with KPIs is they aren’t “vanity metrics.” This reason is why website traffic, for all intents and purposes, isn’t a KPI in itself as it is more of a perceived performance metric.
Having lots of website traffic is good, but what’s more important is how many of those visitors become sales-qualified leads or customers. Therefore, you must break down traffic into smaller acquisition metrics to help you make sense of your site’s visitors.
For instance, a website with less than 1,000 visitors a month closing more than ten new clients is much better than a site with 100,000 monthly visitors with less than ten clients.

What Are KPIs for Websites?
To help optimize your web performance metrics, you must be mindful of the KPIs that govern its success. The better your site’s performance is for these variables, the higher your conversions and sales should be.
Keep in mind that website owners should only track specific performance metrics to help reach their business goals and success. After all, websites have unique business objectives, each requiring different variables to track and measure for success.
With that in mind, here is a shortlist of the top KPIs to measure website performance to help site owners scale their sites better and faster:
Number of Pages Viewed Per Visit
This metric refers to the average number of pages visitors view during their session on the site.
Knowing this figure helps you determine how engaged visitors are with the content. For example, blog and ecommerce site owners can determine the number of pages users are visiting and what these pages are. From here, they can create similar content or offer identical products to increase the number of viewed pages further.
This metric also helps you measure the performance of the widget you’re using that shows relevant pages to visitors. From here, you can edit the related posts or products widget on the page then observe if any of the changes you made increased average page views.
Time Spent on Site
Time spent on site is a part of web traffic metrics that measures the average time a visitor spends on a page on your site.
Measuring the time spent on site is essential because it allows you to understand how your visitors feel about your content.
According to the 2020 Digital Experience Benchmark report by Contentsquare, the average time on a page out of 7 billion-some user sessions reviewed is 62 seconds.
While the time varies depending on which industry you’re in, this is nonetheless an excellent measurement to hold your website accountable for. Because if visitors leave before 62 seconds pass, this indicates content and user experience problems on your site.
Bounce Rate
The bounce rate is the percentage of single-page visits to your website. By providing an optimal user experience, you can keep the rate low, resulting in a higher conversion rate.
Measuring bounce rate is crucial because it can tell a lot about the factors you must improve on your website.
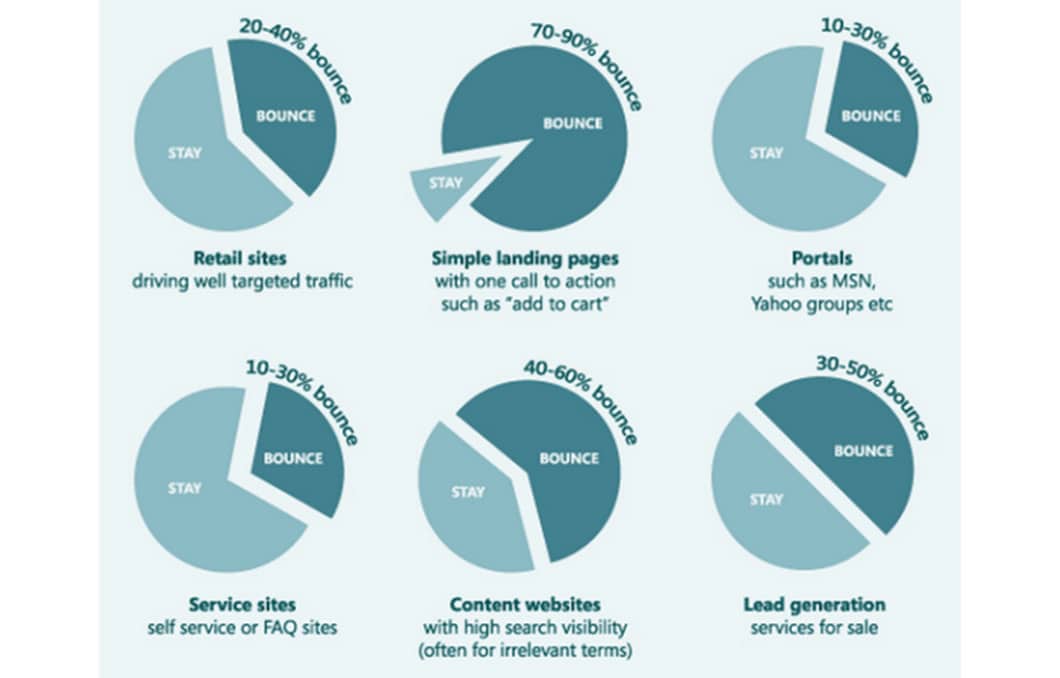
According to digital marketer Neil Patel, the average bounce site of a page or site varies between 10%-90%. Much of the averages have to do with the purpose of the page or site. For instance, 70%-90% of visitors to a simple landing page with a single call to action don’t complete the desired action.
If your site has a higher bounce rate than the ones above, it could be because of the quality of the content, and the topic covered doesn’t match visitor expectations.
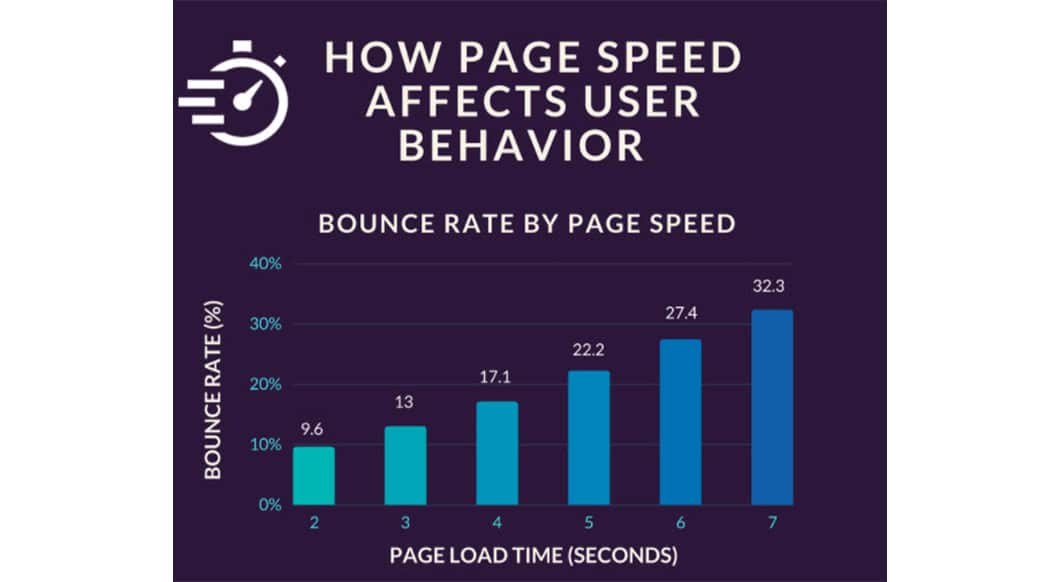
A website having a high bounce rate also could be because the site loads very slowly. A study conducted by Section reveals that if a website takes longer than 5 seconds to load completely, expect 22.2% of its initial visitors to leave the site.
It’s important to know how many bounces you’re getting so you can identify potential problems with your site’s content and load time.
Scroll Depth
Scroll depth refers to how far down the page your readers scroll. This metric can be used to identify how well-written a post is and how interested in reading it people are on average.
This metric is important because it indicates the level of interest your visitors have in your content.
Unlike previous metrics, there is no benchmark among websites when it comes to scroll depth. However, longer pages should demand a higher scroll depth.
For example, a 50% scroll depth for a page with 1,000-word content is acceptable. On the other hand, a 2,500- word article should have a roughly 70% scroll depth.
To improve pages with low scroll depth rates, you must improve your content flow using copywriting tactics. You could also try moving up your call-to-action buttons before the scroll depth rate to squeeze out more conversions from the page.
Referral Traffic
Referral traffic tells you the number or rate of visitors coming from a specific channel. There are 4 primary traffic sources to monitor here:
- Organic Search – Visitors who came from search engines such as Google, Bing, and others.
- Direct – Users typed in your site’s URL from the user’s browser.
- Referral – Traffic that came from third-party sites.
- Social – People that clicked on a link to your site from social media, i.e., Facebook, Twitter, Instagram, etc.
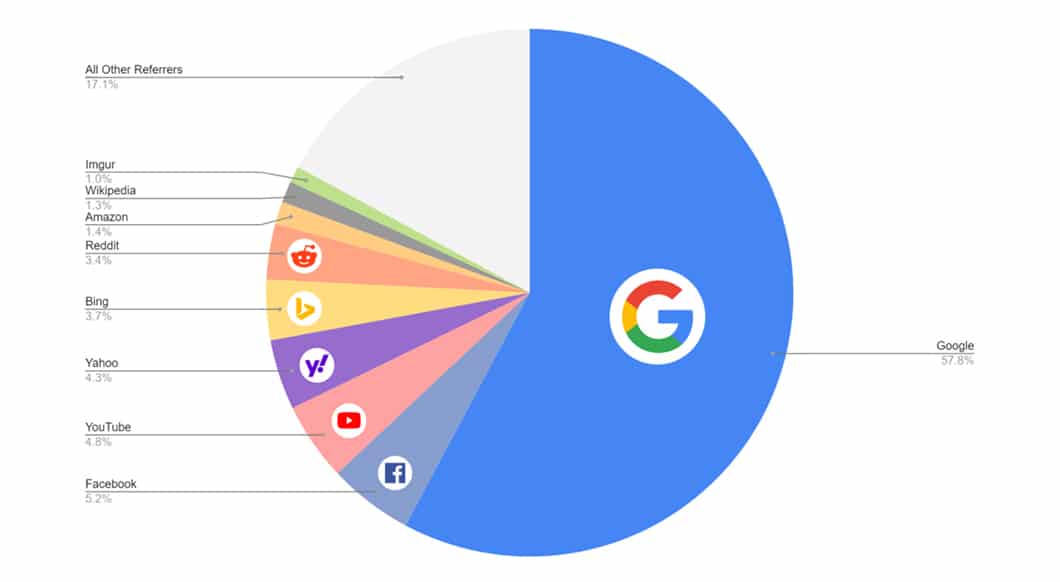
According to SparkToro, among the 4 primary traffic sources you can expect more than half of your website visitors (57.8%) to come from Google.
The great thing about Google is that it constantly crawls the web for pages to index search engine result pages (SERPs) for the most relevant search queries. Also, your page can increase in position over time as long as you observe the best search engine optimization (SEO) practices across all your site pages.
This way, if your site appears on the first page of Google for a keyword searched thousands of times every month, you can generate lots of traffic without constantly promoting it on other channels.
Goal Completions
Goal completions are one of the most essential metrics that measure the percentage of visitors who complete a goal-driven action. The types of goals you must count on your site are as follows:
- Signing up for a newsletter
- Registering for an account
- Clicking on a link (in a landing page)
- Adding a product to the cart
- Entering checkout
These website metrics have a direct impact on your site’s bottom line. The higher the percentage of goal completions, the more successful your efforts are in generating marketing-qualified leads, and thus you can spend less money on online marketing.
Core Web Vitals
Google announced it was officially launching Core Web Vitals as a ranking factor as early as May 2020. And unlike previous updates that dealt with site speed (Mobilegeddon, mobile-first indexing), Core Web Vitals is a collection of user experience metrics concerned with a page’s overall user experience.
Below are the variables measured in Core Web Vitals:
- Largest Contentful Paint – Measures how quickly pages will appear for users who visit them with varying browser speeds and geographical locations worldwide.
- First Input Delay – Measures how long it takes for visitors to engage with your website.
- Cumulative Layout Shift – Measures the stability of a page while it loads. Ideally, elements of the page shouldn’t be moving while it’s loading.
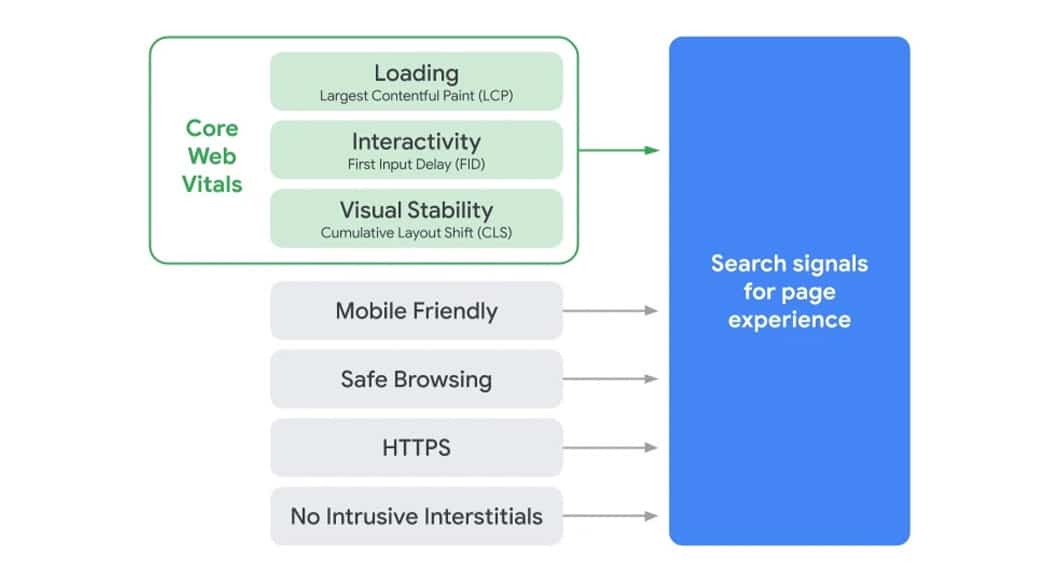
Website owners can measure the Core Web Vital score of their site by heading to Google PageSpeed Insights. From here, they can view how their sites performed based on these website health metrics and suggestions on how to improve them.
Best Tools to Use for Measuring Key Performance Metrics
Monitoring how your site is faring over time can be a handful especially considering the numerous variables mentioned above.
However, keeping a tab of your KPIs should be easy if you know the best tools to track each.
Here are just some of the better tools you can use to help you make sense of your website’s performance and what you can do to improve it.
Google Analytics
Google Analytics is a free website analytics tool that monitors how many users interact with the various parts of a site. It allows you to see how people use your site, how they got there, and what pages are most popular on your site.
It is powerful enough to measure the majority of website analytics KPIs above. All you must do is insert the analytics code on your website just before the </head> section. Once installed, it will track visitor activity on your website and break them down into various subsections.
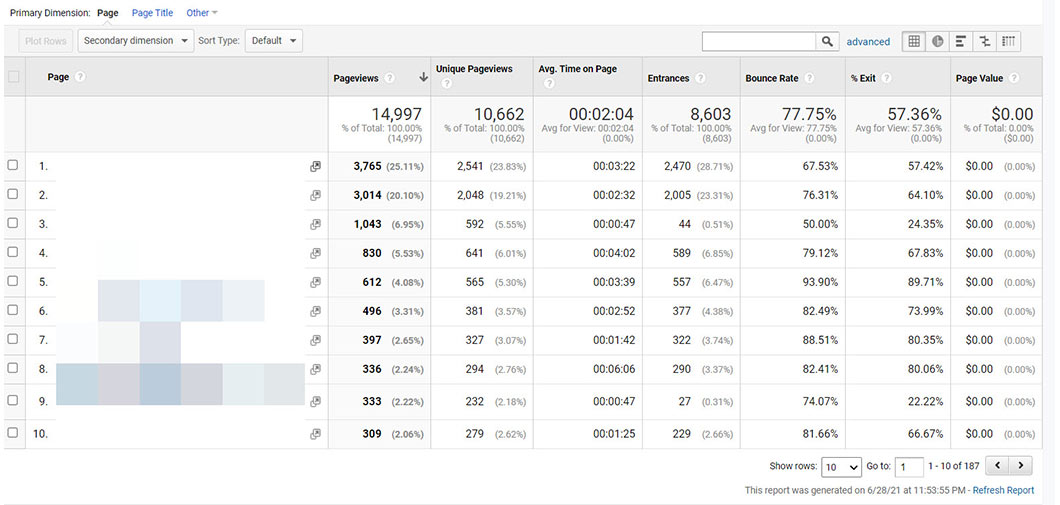
You can view the top-performing pages of your site and check out the KPIs of each. This helps you get granular in analyzing your website’s performance and make improvements on a page level.
You also can create specific goals that you want to track for each page of your site. This way, you can monitor how each page is converting visitors into prospects or customers successfully.
Google Search Console
Google Search Console is another free service by Google that lets you see how your website is indexed and how well its content is ranked. It deals primarily with your site’s organic search performance: the keywords it’s ranking for, the impression they get from SERPs and other metrics relevant to SEO.
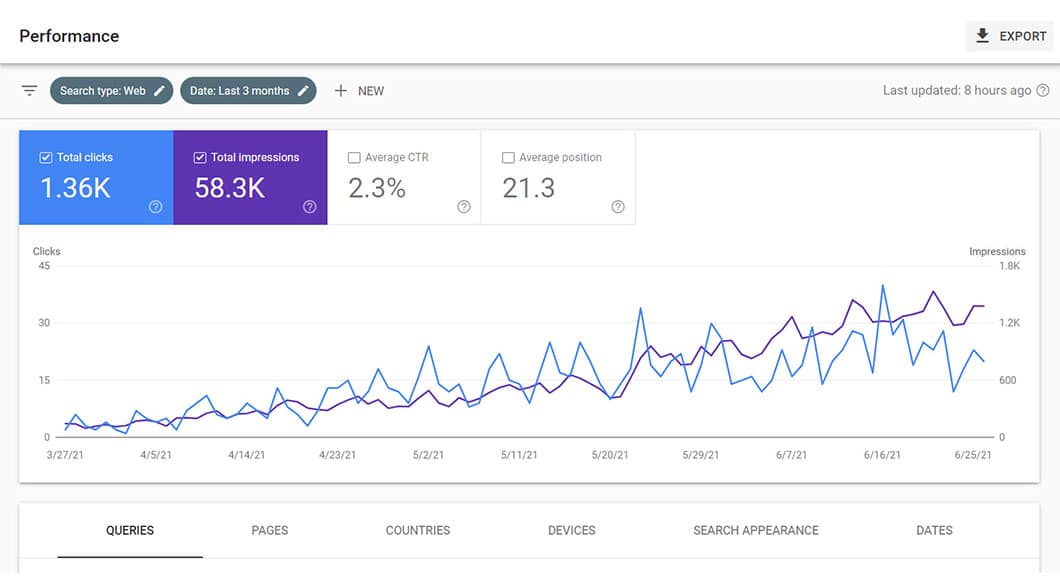
You also can view your site’s Page Experience and Core Web Vital scores. This allows you to monitor which pages need improvement and how you can do it.
Microsoft Clarity
Microsoft Clarity is a free website performance monitoring tool that provides users insight into how their site is performing. It is comparable to Google Analytics because it monitors your site’s progress across different website KPIs to gain insights on how you can make your business site perform better.
However, Clarity works best as a heat-mapping tool that shows how far visitors have gone down each page and portions of the page they clicked on the most.
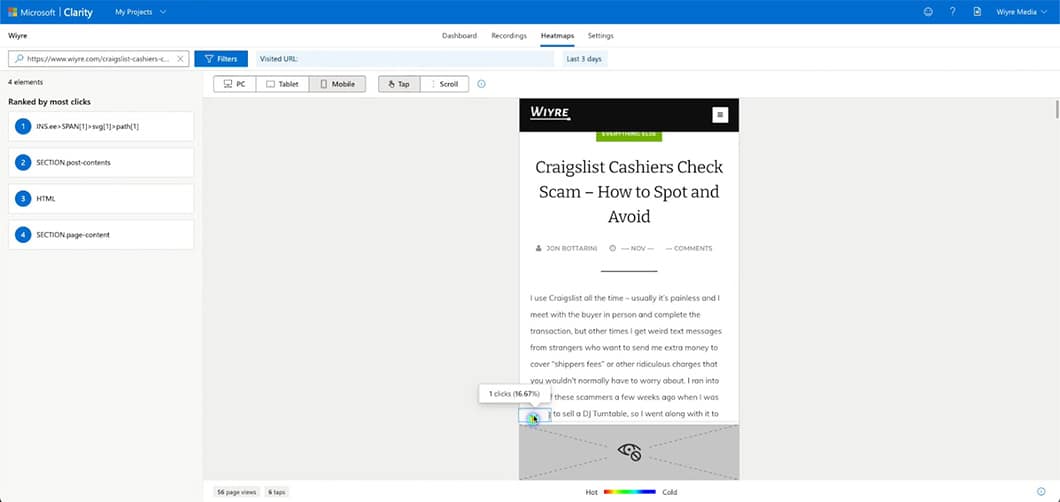
Using this tool helps you understand bottlenecks that prevent visitors from scrolling to the bottom of your page or clicking the right links on your site.
It also has a “Recordings” feature that lets you view visitors’ journeys as they browse through the different pages of your site and how they interact with each other.
Ahrefs
Ahrefs offers an SEO and marketing tool that can measure website performance standards in organic search.
Unlike Google Search Console, this tool allows you to determine where your page is ranking on Google and for which keywords.
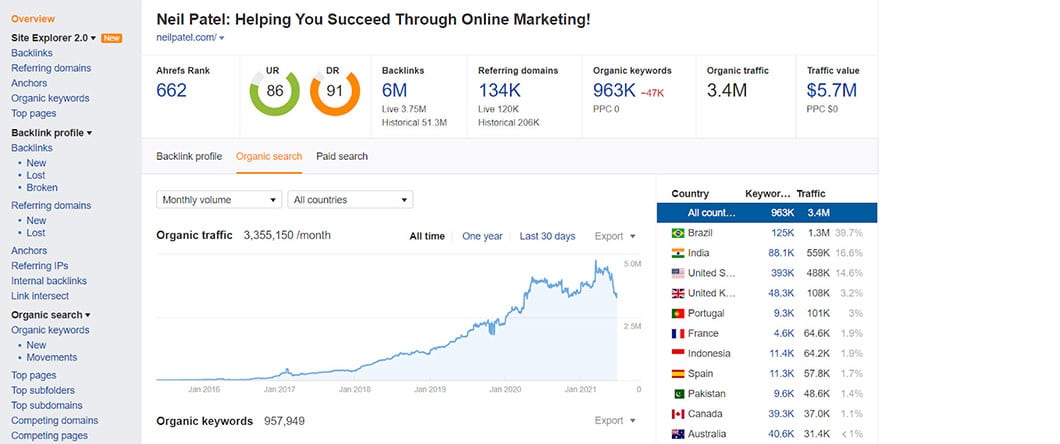
You also can monitor search rankings regularly, so you know which pages moved up its rankings on Google.
Finally, Ahrefs helps you launch and maintain an SEO strategy for your business website by monitoring its backlinks, researching your competitors, and more.
Measure KPIs to Bolster Your Website
As you can see, knowing how to measure website performance metrics will help you understand how to improve your website’s performance.
At this point, it might be intimidating because there are lots of KPIs you can measure using different tools and software.
However, you must pay attention only to metrics that will help your business succeed.
By choosing which among the variables above you should focus on, you can generate the insights necessary to help your site improve its marketing methods to generate more sales.