

As a small business owner, you wear many hats. You’re the strategic visionary, salesperson, chief marketer, HR manager, supervisor and maybe even the front-line customer service rep. Not to mention you stay ahead of the competition, motivating your team and keeping up with industry trends.
That’s a lot to juggle and we haven’t even talked about the financial side of things. To change the world, you’ve got to keep the lights on, right?
Manage your company’s money easily by understanding and tracking the following 14 financial key performance indicators (KPIs):
- Operating cash flow
- Sales growth
- Earnings before interest and taxes (EBIT)
- Transaction error rate
- Current ratio
- Quick ratio (acid test)
- Burn rate
- Gross profit margin
- Net profit margin
- Working capital
- Return on equity
- Debt-to-equity ratio
- Current accounts receivable
- Current accounts payable
So let’s dive into each of these financial KPIs, with examples, and review why they’re all crucial to your business.
1. Operating Cash Flow
There’s a reason this one is first on your cash-flow statements (and one of the best financial KPIs to track): It’s a way to tell if your business is earning enough to keep operating. Your operating cash flow is how much money your business earns through regular business activities.
The simplest way to track this is by adding up all your inflows (sales, invoices) and subtracting outflows (purchases, expenses, etc.). The remaining figure is your operating cash flow.
We’ll get into more specific cash-flow measurements later.
2. Sales Growth
This finance KPI is the percentage of revenue growth over a set period of time. For example, you can analyze sales growth by reviewing how much your revenue grew this year versus last year.
Would anyone want to invest in a company that was losing money year over year? Not likely.
Knowing this key financial KPI is also what allows you to set forecasts and goals for growth.
3. Earnings Before Interest and Taxes (EBIT)
Another one of the most common financial KPIs, EBIT is a basic calculation of your income minus expenses, before you count any interest and taxes. It’s a basic gauge of profitability that tells you if you’re consistently spending more than you’re making.
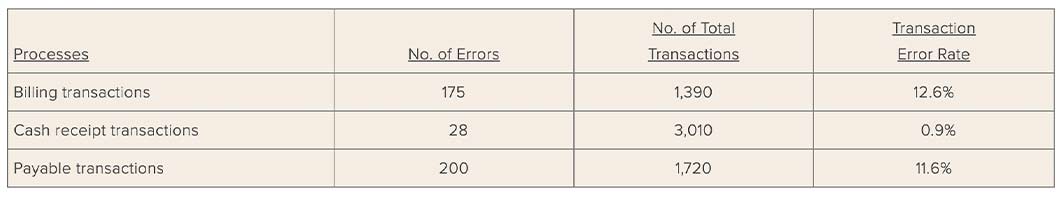
4. Transaction Error Rate
A transaction error can be anything from a form being filled out incorrectly to money deposited in the wrong account or expenses not being properly tracked or deducted for income tax purposes. Transactions are funneled into 3 main categories: payable, billing and cash receipts.
Making errors is human nature, but too many can quickly erode your overall efficiency and have a harmful impact on profitability.
Track the error rate of each of the 3 transaction categories so you have an idea of where systems are breaking down if there is an issue.
In this financial KPI example from Accounting Tools, you can see the cash transaction error rate is 0.9% but the billing error rate is 12.6%. From this, we can surmise that something is happening in the billing software to cause such a high level of mistakes — and it’s costing you money.
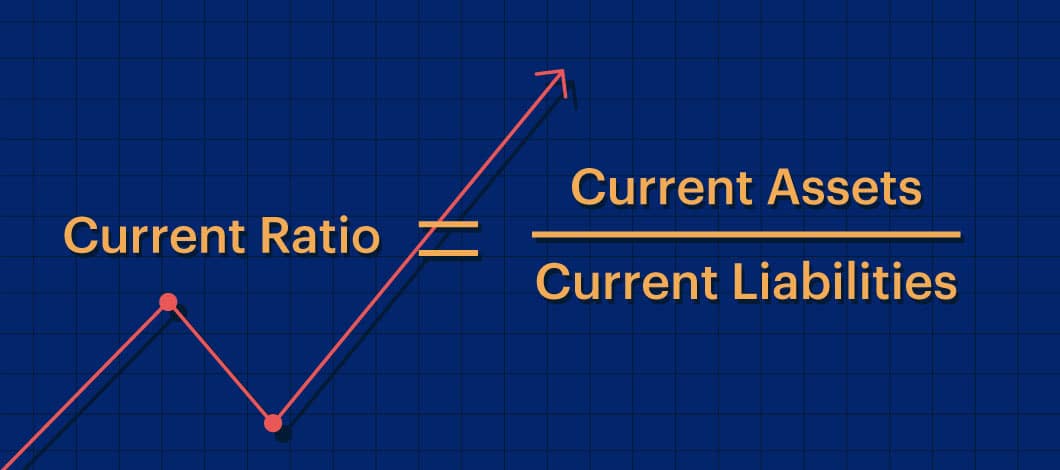
5. Current Ratio
Another one of the top finance KPIs to make our list is current ratio, which is a measure of how solid your business is on a short-term basis, usually defined as 1 year. The current ratio shows whether you’re able to pay your upcoming obligations based on current revenue and the assets you own.
It isn’t a perfect measurement, but it gives you a quick glance at the stability of your business.
The formula to calculate this is current assets divided by current liabilities.
Ratios are judged based on industry averages, so if you’re in line with or slightly better off than most in your industry, banks are happy with that.
6. Quick Ratio (Acid Test)
Similar to the current ratio, a quick ratio (also known as an acid test) measures your current assets against short-term liabilities. However, it only counts assets that would be quick to sell, such as cash, cash equivalents (e.g., investment accounts) and occasionally accounts receivable.
This ratio ignores assets that would be difficult or take a long time to sell, such as real estate, inventory, equipment and other property.
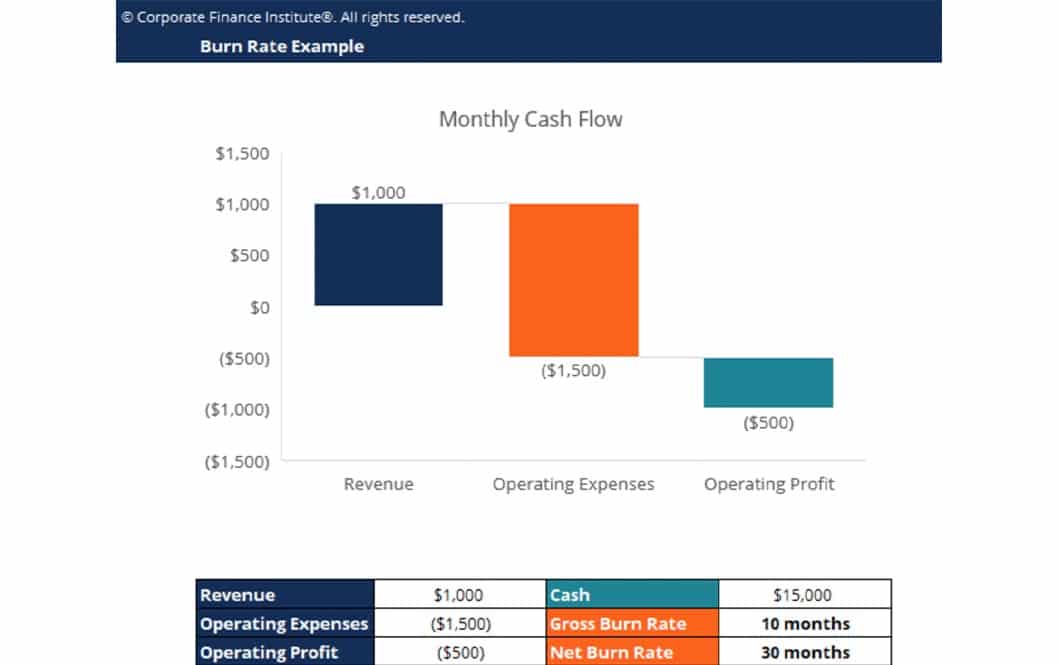
7. Burn Rate
Not as fun as it sounds, this financial KPI’s meaning refers to how quickly your company is depleting your revenue — or burning through money.
Many startups don’t turn a net profit for months or even a year, as everything earned typically goes back into the business to improve the product or acquire new customers.
In cases like this, where profitability isn’t expected right away, investors look at how quickly a company is going through cash to get an idea of what its value is and how likely it is to turn a profit in the future. Additionally, the burn rate tells investors if the company is able to increase revenues through marketing efforts. It also tells them how far their investment will take the company in time.
Burn rate can be tracked with a monthly cash-flow statement, such as this example below from Corporate Finance Institute. You take your revenue and subtract expenses. If your remaining profit is in the negative, that’s the burn amount.
If you have $5,000 in cash assets to survive off of before you need to turn a profit (or get an investor), then your burn rate is that figure divided by the negative profit amount. In this case, it would be $5,000 / $500 = 10, meaning you have 10 months until you’ve burned through all your assets.
8. Gross Profit Margin
Gross profit margin is your overall revenue (sales) minus your cost of goods (COGS) sold.
Cost of goods sold will include different things depending on the business, but common things to factor in are your raw materials for making your product or delivering your service, plus factors such as overhead, electricity, equipment leases and, of course, labor.
Generally, rent or mortgage costs and sales or marketing expenses aren’t included in a COGS calculation.
9. Net Profit Margin
Net profit margin is where things get more specific, moving from a general show of profitability to a precise calculation of a company’s true profit.
This takes everything in the gross profit margin calculation above and adds in all other expenses, such as rent, sales and marketing.
This number is essentially how much you get to keep from every dollar your company earns, and it’s an important measure of profitability and efficiency.
Before you can know this, you need to know your net profits (Revenue – COGS) and net sales (Revenue – Returns and Transaction Fees).
10. Working Capital
Working capital KPIs are similar to quick ratios. However, working capital KPI is a short-term measure, like a snapshot of your business on any given week or month.
Working capital features all your current assets (cash, accounts receivable, inventory, etc.), minus your current liabilities (accounts payable, operating expenses).
If you’re regularly earning more than you spend, you should think about growth opportunities or ways to invest that capital.
If you aren’t, it’s time to improve your efficiency, profit margin or make some other tough calls to bring your books in line.
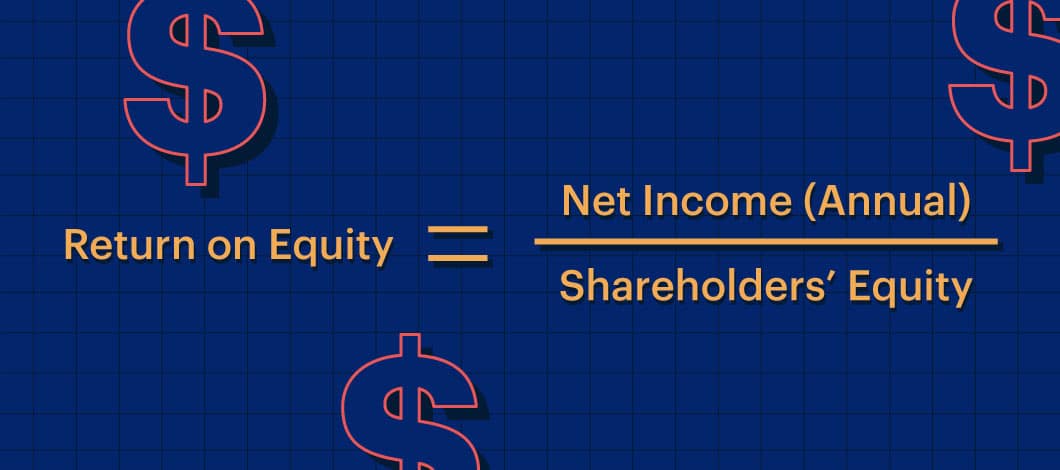
11. Return on Equity
This financial performance indicator is key for attracting investors (and keeping your current ones happy).
Return on equity is your company’s net income divided by shareholder equity (or, in the case of a company without shareholders, the owner’s equity).
This number is a percent and reflects the financial growth for shareholders over the previous year.
This finance KPI shows your company is able to take in investments and actually turn a profit with them. It also shows precisely how much profit was generated by those investments.
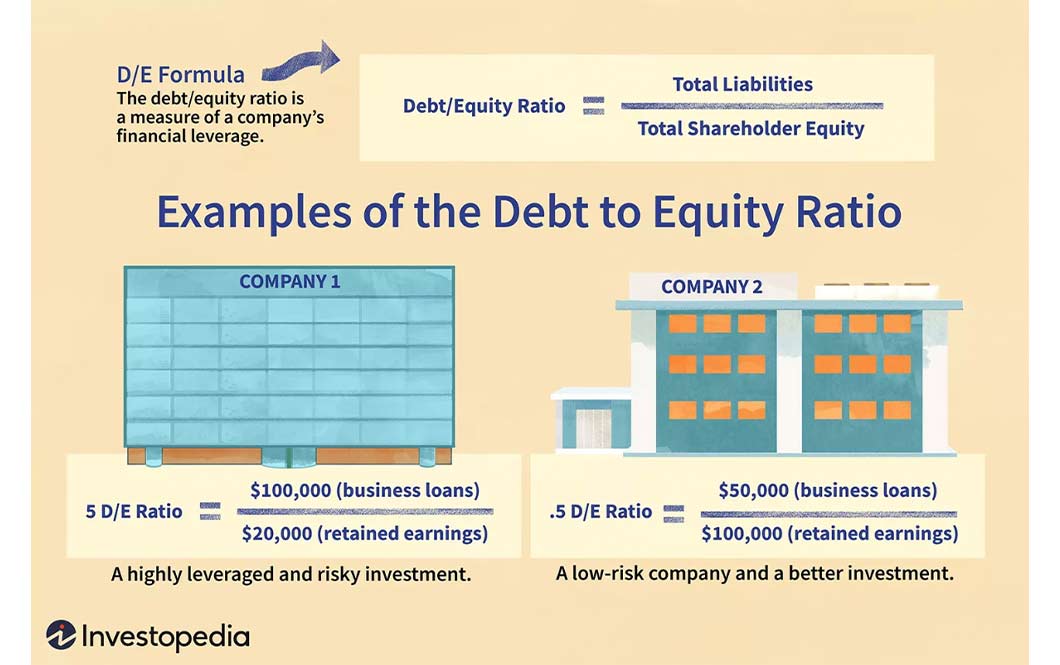
12. Debt-to-Equity Ratio
Similar to the above, debt to equity is your company’s total liabilities divided by total shareholder equity.
This ratio is important for evaluating the risk level of your business, especially when it comes to seeking investment from others or trying to qualify for a business loan. If you’re overleveraged, most lenders will take a hard pass.
In the examples below from Investopedia, we can see the risk difference between Company 1 and Company 2. Company 1 has 5 times as much debt as it does revenue, which is a high risk for loan default. However, Company 2 earns twice as much as it owes, a safe bet for most lenders.
13. Current Accounts Receivable
This is a simple one you should be able to assess at all times. Your accounting software should be able to spit out this number in 2 seconds. Your receivables are the amount of money currently owed to you by all your customers.
This can be made up of invoices, pending sales charges or invoices that will become due in the time period you’re looking at. Most people tally this number on a monthly basis, but it can be any period of time from a few days to a year.
14. Current Accounts Payable
This is all the money you owe in terms of vendor invoices, contractor bills or other business expenses. It doesn’t include your payroll.
Sometimes, you may choose to pay bills later than you normally would to accrue capital to use for other things. Other times, you may pay your bills instantly. Whatever your cash-flow goals, you should always pay bills before their due date.
Why These Financial KPIs Matter
We get it. You didn’t start your business to stare at spreadsheets and punch numbers into a calculator. When someone asks what you do, your eyes light up talking about the handmade products you create or the life-changing services you offer. They certainly don’t light up at the words “transaction error rate.”
But here’s the thing: You need to know and get excited about these numbers, too. Maybe not the level of excitement you have for your company’s purpose, but pretty close.
Why? Three little words: investment and growth.
Let’s say you want to expand your factory to produce more products and enter new markets. Or, lease a larger office space and hire more staff, allowing you to take on more clients.
Awesome, right? Until it comes time to get the money to make it happen.
Whether you seek business financing from a lender or go the investor route, the person on the end of the conversation isn’t interested in hearing you go on and on about how you import all of your production materials because only the best quality will do.
The lender or investor is interested in the cold, hard numbers. They’re asking themselves what your cash-flow KPIs look like, with questions such as the following:
- Is this person in a solid financial position to make this expansion successful?
- What is the risk level I’m taking by investing in this business?
- How does this business currently handle accounts?
- Does this business have a proven track record of balanced budgets and paying vendors on time?
Without solid, irrefutable proof of those answers, it will be difficult (nearly impossible, actually) to secure a capital investment to make your business dreams a reality.
And if you think this article isn’t for you because you’re not planning on taking out a business loan or seeking an investor. Newsflash: The health of these financial KPIs directly equals the health of your company.
Grow Your Company By Knowing These Financial KPIs for Business
You can’t plan for your future growth — investment-seeking or not — without first knowing these top financial KPIs. To put it another way, you can’t grow what you don’t know.
Catchy rhymes aside, being unaware of these key figures is like taking a running stab in the dark at profitability, never knowing if you actually reach it.
Understanding the meaning of these financial KPIs for business can be the difference between success or failure in any industry.
It can also mean securing a life-changing business loan or investment to expand beyond your wildest dreams or watching the opportunity of a lifetime slip by, unable to act because no one will lend to you.
Working in your business is probably where you’re the happiest, but don’t forget to work on your business, too. The numbers don’t lie, and if you let them, they can even be your biggest asset.